Modulo Digital Twin finds the sites that already have the power
It screens the commercial and industrial parcels in a metro and ranks each by the power a pod can use today and the room it can add later. Every number shows where it came from and how sure we are.
- Power today
- 180 kWLowest hour, summer weekday
- Power upside
- +250 kWBattery with solar, 6–12 months
What you get
What you bring, what Modulo Digital Twin does with it, and what comes out.
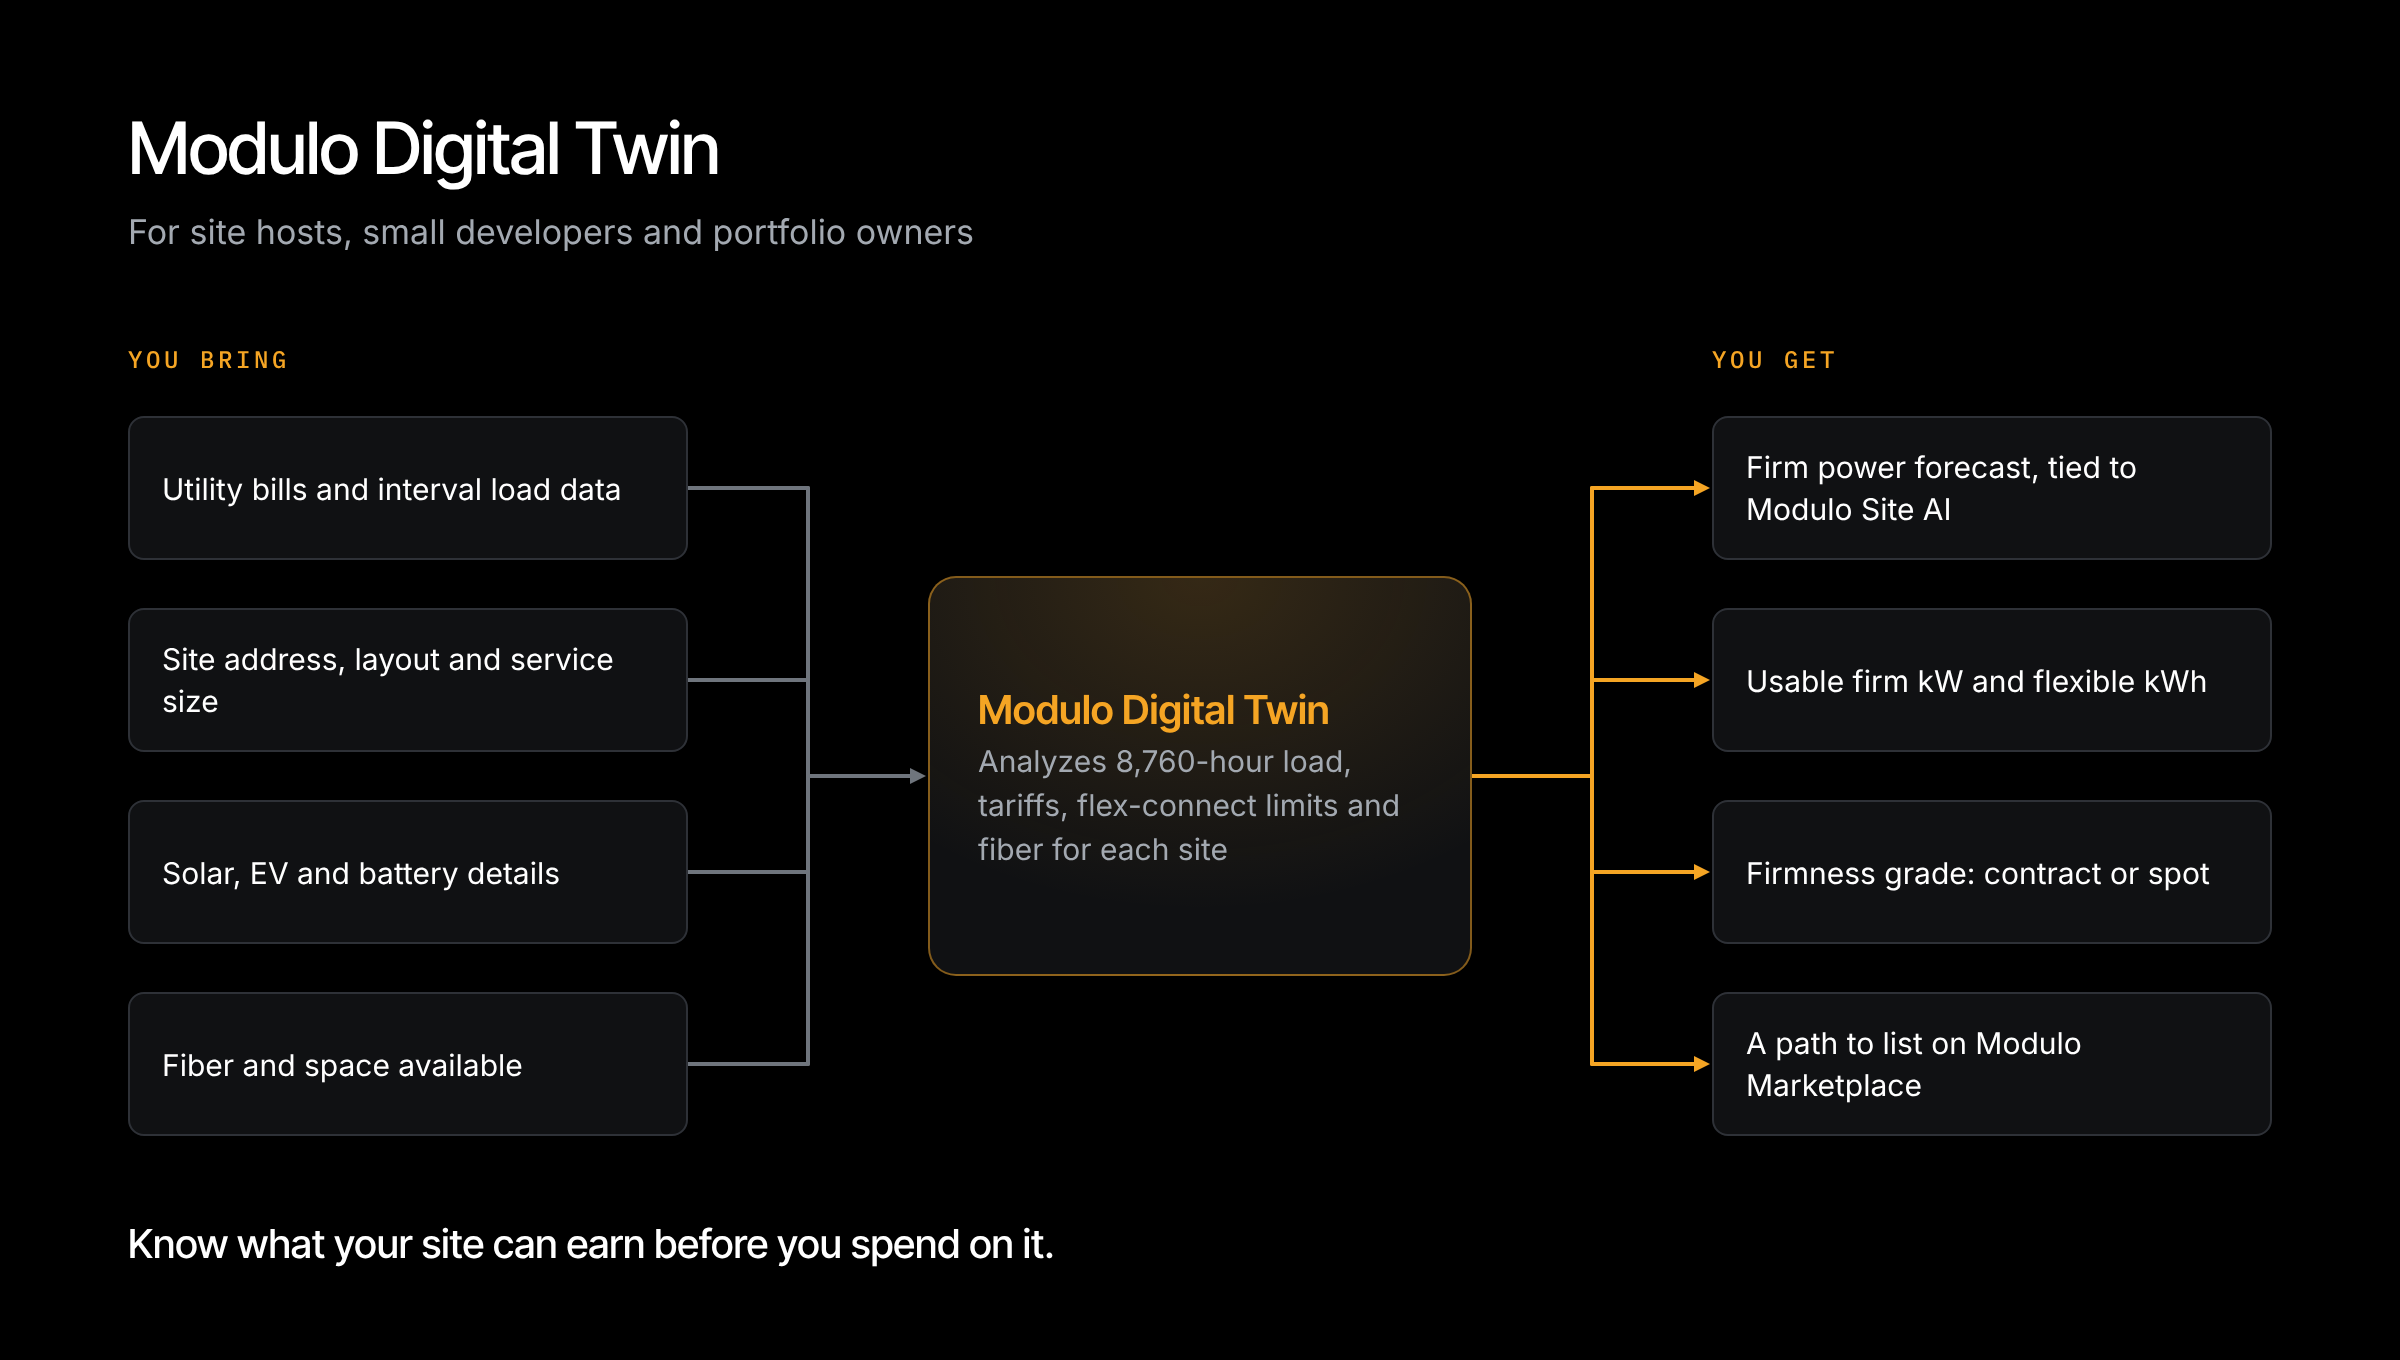
Meet Modulo Digital Twin
Power decides where a pod can go, and today finding it takes a site visit per host. Modulo Digital Twin does the first pass from a desk, in minutes per site, then asks the host only for what would settle the open questions.
Every site gets
- Power today
kW a pod can draw on the existing service, hour by hour, with no utility work.
- Power upside
Extra kW from a flexible connection, a battery with solar, a bigger service or a rotated battery, each with a date and a cost range.
- A readiness tier
Ready now, ready in 6 to 18 months, or not on this pod's clock.
- Ready now
- Enough headroom for a pod in every hour, and every gate passed
- 6 to 18 months
- The upside reaches a pod's power without upstream utility work
- Not on this clock
- Needs circuit or substation work, with no flexible bridge
Eight factors, three kinds
Four set the power, three decide whether a pod fits at all, and imagery feeds most of them.
- Site load
- 12-month peak, hourly shape by season, headroom under NEC 220.87
- Grid headroom
- Feeder capacity by hour, planned upgrades, flexible-connection eligibility
- Solar
- Existing panels, roof and canopy potential, hour by hour
- Batteries nearby
- Sites within 25 miles that could share a mobile battery
- Fiber
- Providers at the address, distance to the nearest internet exchange
- Space
- Room for a pod and a battery pad with 10 ft clearances, plus truck access
- Zoning and permits
- Whether third-party compute is allowed, setbacks, battery fire-permit path
- Aerial and street images
- Roof and yard areas, panels, switchgear, transformers, access
- Bills and meter data
- Read by document models into a fixed schema
- Nameplate photos
- Main breaker, voltage and transformer size, read twice before they count
- Zoning code
- Answered from the code text, with the section quoted
How sure we are depends on what we've seen
Each reading keeps its source, date and a link to the evidence. A low-confidence number shows as an estimate, along with the photo or document that would settle it.
- 12 months of 15-minute meter data
- High
- Bills plus a nameplate photo
- Medium
- Bills only
- Medium-low
- An imagery estimate or a building-type profile
- Low
From desk to live site
Most of the work happens before anyone drives out.
- 01
Screen
Draw an area or upload a list of addresses.
- 02
Shortlist
Compare site cards, add notes, export.
- 03
Ask the host
Bills and photos, or meter data shared from the utility.
- 04
Confirm
An engineer checks the evidence before the visit.
- 05
Hand off
The site's digital twin seeds the Modulo Orchestrator.
What a host shares
- The address
- The last 12 electric bills
- A photo of the main breaker and its nameplate
- Optional: access to the utility's Green Button meter data
What IdlePower returns
- Power today, hour by hour
- Power upside, with dates and costs
- A readiness tier and the gates it passed
- What a pod could earn there
PG&E, SCE and Con Edison territories first
All three publish where their grids have room: PG&E's GRIP maps, SCE's DRPEP maps and Con Edison's hosting capacity maps. In California, flexible service connections come under CPUC decision D.26-02-025.
Know before you spend
Demand ratchets, facility demand charges and coincident peaks can each erase a site's economics, and none of them show up in a quick estimate. Modulo Digital Twin finds them before anyone spends money on equipment.
- A full year, hour by hour
Load, solar, EV charging and weather for all 8,760 hours, so the answer holds in August as well as April.
- Tariffs read in full
Demand ratchets and facility charges are flagged, and sites that carry them are ranked down.
- Forecasts Modulo Site AI can deliver
Every forecast is tied to how Modulo Site AI will run the site, so what we promise is what you get.
- Load
- Building, EV and solar, 8,760 hours
- Grid
- Service size, transformer headroom, flex-connect limit
- Tariff
- Demand charges, ratchets, on-peak windows
- Site
- Space, zoning, fiber, rights to place equipment